
Suburb Micro-Analysis: How to Spot a High-Growth Area Before the Boom
Most Australian property investors rely on outdated data; they track the national headlines, watch the capital city medians, and wait for the next big "boom" to be announced. In doing so, they miss the real opportunity.…
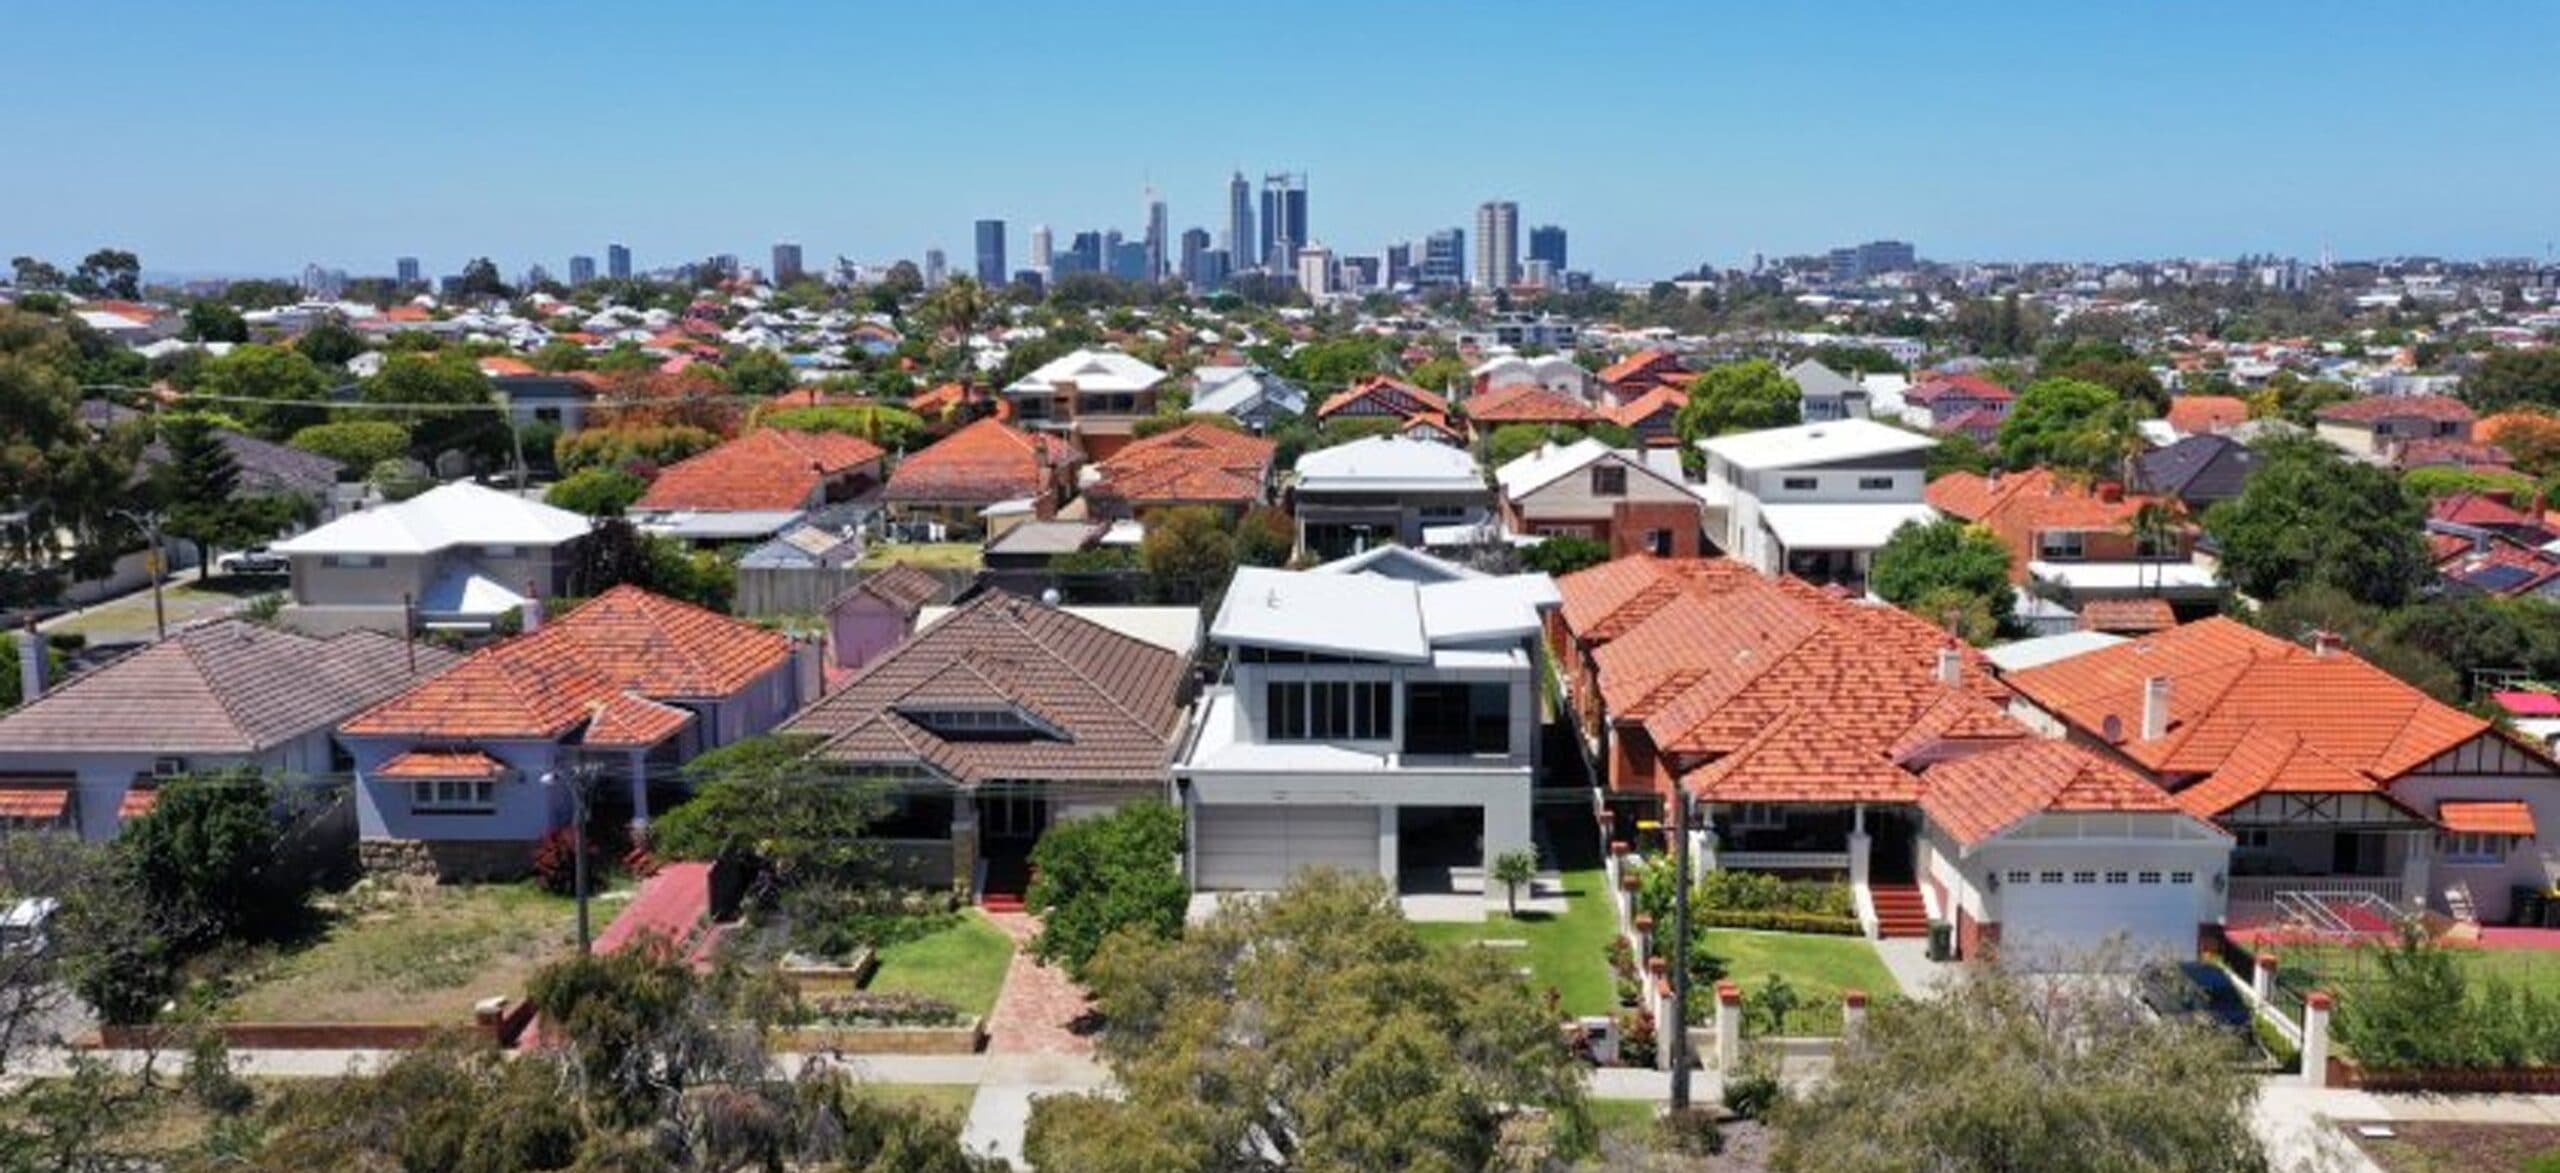
Most Australian property investors rely on outdated data; they track the national headlines, watch the capital city medians, and wait for the next big "boom" to be announced.
In doing so, they miss the real opportunity. By the time a suburb is named a "hotspot", the initial, most profitable growth phase is often over. The early investors have already bought in, and prices are rising for everyone else to see.
You have to understand that the key to smart returns from your investment isn't in the big, confusing, flashy reports that you generate through trending articles or with the help of GPT, the great!
Instead, the key to smart returns from your investment lies in the small, early signals at the suburb level, also known as suburb micro-analysis. This strategy requires a shift in focus from the broad, noisy macro picture to the quiet, telling details at the suburb level.
This guide breaks down, in simple terms:
- What micro-analysis actually is (and how it differs from the data you already see).
- The guide explains the specific, easy-to-spot signals that indicate a suburb is heating up, even before price spikes appear in quarterly reports.
- Common pitfalls, such as suburbs with high yields but no growth, often trap investors.
- Ending up with the one-stop solution that can help you navigate your investment journey, not just with confidence but actually with backbone support throughout the journey.
Let's start.
What is Suburb Micro-Analysis?
To understand micro-analysis, you must first see the limitations of the data you're probably using now.
Macro Markets vs. Micro Suburbs: The Critical Difference
- Macro Data looks at states or cities. A headline like "Sydney prices up 8% this year" is an average. It tells you the tide is rising but hides which boats are soaring on a wave and which are barely floating. It's retrospective, slow, and designed for mass consumption.
- Micro Data zooms into a single postcode, even a specific street. It asks, "What's happening here, right now?" It's proactive, timely, and specific to your single, most important asset: the property you buy.
As data expert Jeremy Sheppard clarifies, the core of "big data" isn't about a large area but the "number of different datasets" you can analyse. By layering these hyper-local data sets, you can gain true insight and see a complete picture before a flashy headline confuses you. Let's look at 2025's actual results to understand this better.
When discussing Perth's performance for the entire year, the city experienced an average growth of around 15%, making it one of the strongest capital cities.
But at the suburb level: Mandogalup: 33% growth
Kalbarri (regional WA): 40.2% growth
Other Perth suburbs: 5-7% growth
Moving on, if we talk about darwin's overall performance, it is the strongest capital city at 17.1% average growth.
But at the suburb level: Gray (units): 33.3% growth
Other Darwin suburbs: 8-12% growth
According to Cotality's 2025 Best of the Best report, lower-priced suburbs generally delivered the strongest gains. But it wasn't all lower-priced suburbs; it was specific ones where supply was limited and demand was rising.
As Parag Dixit from PropWealth explains, "The biggest mistake I see investors make is chasing state-level trends without understanding that every city contains dozens of micro-markets, each with completely different supply and demand dynamics."
The Engine of Growth: Supply, Demand & Micro-Market Drivers
Sustained price growth requires a simple equation: Increasing Demand + Constrained Supply = Price Pressure. Micro-analysis finds the evidence for both sides of this equation.
1. Supply Fundamentals: Limited Supply = Rising Prices
One of the most important micro-market indicators is supply. Simple economics: when demand is strong but supply is limited, prices go up.
What creates limited supply in a suburb?
- Geographic constraints (coastal areas, national parks, waterways)
- Heritage overlays preventing new development
- Limited land availability
- Strict planning regulations
These suburbs have a built-in scarcity that protects property values even when broader markets soften. Julius Dabre from PropWealth puts it simply: "We look for suburbs where supply is constrained by geography or planning regulations. These areas have a scarcity mechanism protecting your investment."
But watch out for the opposite problem: Oversupply.
Upon discovering that 12 new apartment towers have received approval for the next three years, some suburbs may appear attractive. The approval of 12 new apartment towers for the next three years is not a growth opportunity but rather a supply explosion that will suppress prices and rental yields.
According to Luke Metcalfe, Chief Data Scientist at Microburbs, "Good data reveals patterns you can't see from surface-level research. It cuts through hype and tells you whether a suburb has the fundamentals that will sustain your investment."
2. Demand Signals Most Investors Miss
Supply is only half the equation. You also need to understand demand specifically, what type of demand is driving the market.
Owner-Occupier Demand vs Investor Demand
The character of buyers matters, as areas attracting owner-occupiers, particularly families and professionals, tend to see more stable, long-term growth. These buyers invest in their homes (renovations, gardens) and community, directly lifting the area's appeal and values. A suburb shifting from 40% to 60% owner-occupier is a powerful, early demographic signal.
What happened in Darwin in 2025?
Investor loans doubled year over year, creating short-term price momentum. But the increase raises questions about long-term sustainability. According to Cotality, investors accounted for 41.1% of new lending in Queensland and 38.3% in Western Australia.
The ideal mix: suburbs with 65–75% owner-occupiers. You get stability from people who won't panic-sell during market downturns, plus enough investor activity to ensure liquidity when you want to sell.
Days on Market (DOM)
Another key demand signal is how quickly properties are selling. Properties sold in under 30–40 days indicate strong buyer demand and competition. When the average day on the market is under 65, those suburbs consistently show stronger capital growth.
Auction clearance rates also matter
When 70%+ of properties sell at auction, you're seeing real buyer confidence. Below 60%? Buyers are hesitating, and that eventually shows up in weaker prices.
3. Demographic Shifts That Signal Early Growth
Young families moving into a suburb is one of the strongest early growth signals.
Why families matter:
- They bring stability (enroll kids in schools, join the community)
- They improve properties and invest in the area
- They don't move frequently (creating sustained demand)
Look for suburbs experiencing "household formation" when young professionals in their late twenties to mid-thirties are settling down, having kids, and buying homes. They typically can't afford premium suburbs yet, so they pioneer the next ring out, slowly gentrifying older areas and driving up values. Suburbs that saw increases in the 30-44 age demographic over the past five years consistently outperformed suburbs with ageing populations.
Another signal is Rising education levels: When more university-educated residents move in, property values typically follow. These residents earn more, invest in their properties, and demand better local amenities.
4. Infrastructure & Economic Drivers
Infrastructure investment is one of the most predictable drivers of property growth. But timing and proximity matter. Australia's infrastructure pipeline currently sits at $213 billion through to FY2027-28, including:
- Sydney's Metro expansion
- Perth's METRONET
- Brisbane's Cross River Rail
Being close to infrastructure that shortens commute times is crucial. When a new rail line cuts 20 minutes off the journey to the CBD, properties near those stations can jump 15-20% within two years of the line opening. Invest in properties 2-3 years before major infrastructure is completed. At this point, it's fully funded and construction is underway, but the big price surge hasn't hit yet.
As Julius from PropWealth explains, "Look for infrastructure solving real economic problems, not just government spending. That's where sustainable property demand comes from."
5. Interpreting Property-Specific Data Correctly
Median Price Growth vs Sales Volumes: Here's a common mistake, looking at median price growth without checking how many properties actually sold. If a suburb's median price appears to be growing but it's based on only 5-10 sales per quarter, you're looking at statistical noise, not a genuine trend. One expensive property selling can skew the entire median.
What to look for:
Houses: At least 20-30 sales per quarter
Units: At least 40-50 sales per quarter
This process ensures the data is meaningful and there's enough market depth for you to sell when the time comes.
Consistent Growth vs One-Off Spikes: Getting excited about a suburb that jumped 25% in one year. That growth might have come from:
- A single large development completing
- A statistical quirk in the data
- A one-off event that won't repeat
What you actually want is consistent, sustainable growth over multiple years. A suburb delivering 6-8% annual growth for five straight years will build you far more wealth than one that spikes 20% then stagnates.
According to Parag from PropWealth, "We choose suburbs with steady 7% growth over ones spiking 15% last year. Consistency means predictable returns and proven fundamentals."
Red Flags in Suburbs That Look Good But Will Underperform
Not every suburb with positive stats is a winner. PropWealth’s Julius Dabre often warns clients about these traps:
A. The High-Yield, No-Growth Trap: A suburb offering a 7%+ gross rental yield can be seductive. However, in many regional or outer-fringe areas, this high yield exists because there's little to no capital growth expectation. High income compensates investors for low growth. Your capital may stagnate for a decade. Always ask: Is the high yield masking a fundamental lack of demand from owner-occupiers?
B. Investor-Driven Suburbs: When 60%+ of a suburb's properties are investor-owned, you're dealing with herd dynamics. When investor sentiment shifts, multiple landlords try to exit simultaneously, flooding supply and suppressing prices. During the 2025 interest rate cycle, investor-heavy suburbs showed much higher volatility. Additionally, these suburbs often feature poorly maintained parks, struggling local businesses, and fluctuating enrolment in schools.
Insider Tip: Your One-Stop Solution
You might be thinking, "How am I supposed to analyze all of this while working full-time?" That's exactly what we solve at PropWealth.
We screen the entire Australian market using quantitative filters across over 150 data points per suburb:
- Development approvals
- Construction rates
- Demographic shifts
- Infrastructure timelines
- Sales volumes and velocity
- Owner-occupier ratios
However, our experts believe that data alone isn't enough to make sure our client is on the right path. Julius and Parag personally inspect target areas, meeting with local agents, councils, and developers. Often, what appears promising in the data may not hold up in the real world.
Therefore, our experts always analyze how suburbs performed through different market cycles, examine the 2-10 year forward pipeline, and match everything to your specific investment goals.Our approach isn't about finding "the best suburb in Australia". It's about finding the right suburb for you, one that aligns with your strategy, budget, and goals while offering genuine growth based on fundamentals. Ready to find your next high-growth opportunity? Book your free consultation call with Australia's leading experts at a time that works best for you!