
What the Next Market Cycle Means for Australian Investors
If you've been watching the Australian property market with a mix of curiosity and confusion, you're not alone. One minute, the headlines are screaming about Brisbane's meteoric rise; the next, they're questioning…

If you've been watching the Australian property market with a mix of curiosity and confusion, you're not alone. One minute, the headlines are screaming about Brisbane's meteoric rise; the next, they're questioning whether Melbourne has lost its old marketplace. It's enough to make any investor's head spin.
But here's the thing about property markets, they're not random. They move in patterns. They breathe in, they breathe out and right now, Australia's property market is taking a breath that's about to blow in a very specific direction.
At Propwealth, we're not just watching the cycle. We're watching where the cycle is going next. Let's break down exactly what's happening, why it matters, and how you can position yourself for what comes next.
Understanding the Australian Property Cycle
Before we dive into where we are, let's get clear on what we're looking at. Before we dive into where we are, let's get clear on what we're looking at. The property cycle isn't a straight line; it's a series of phases that repeat, overlap, and sometimes surprise us. Scan it briefly to establish a basis for understanding the blog's further market dynamics.
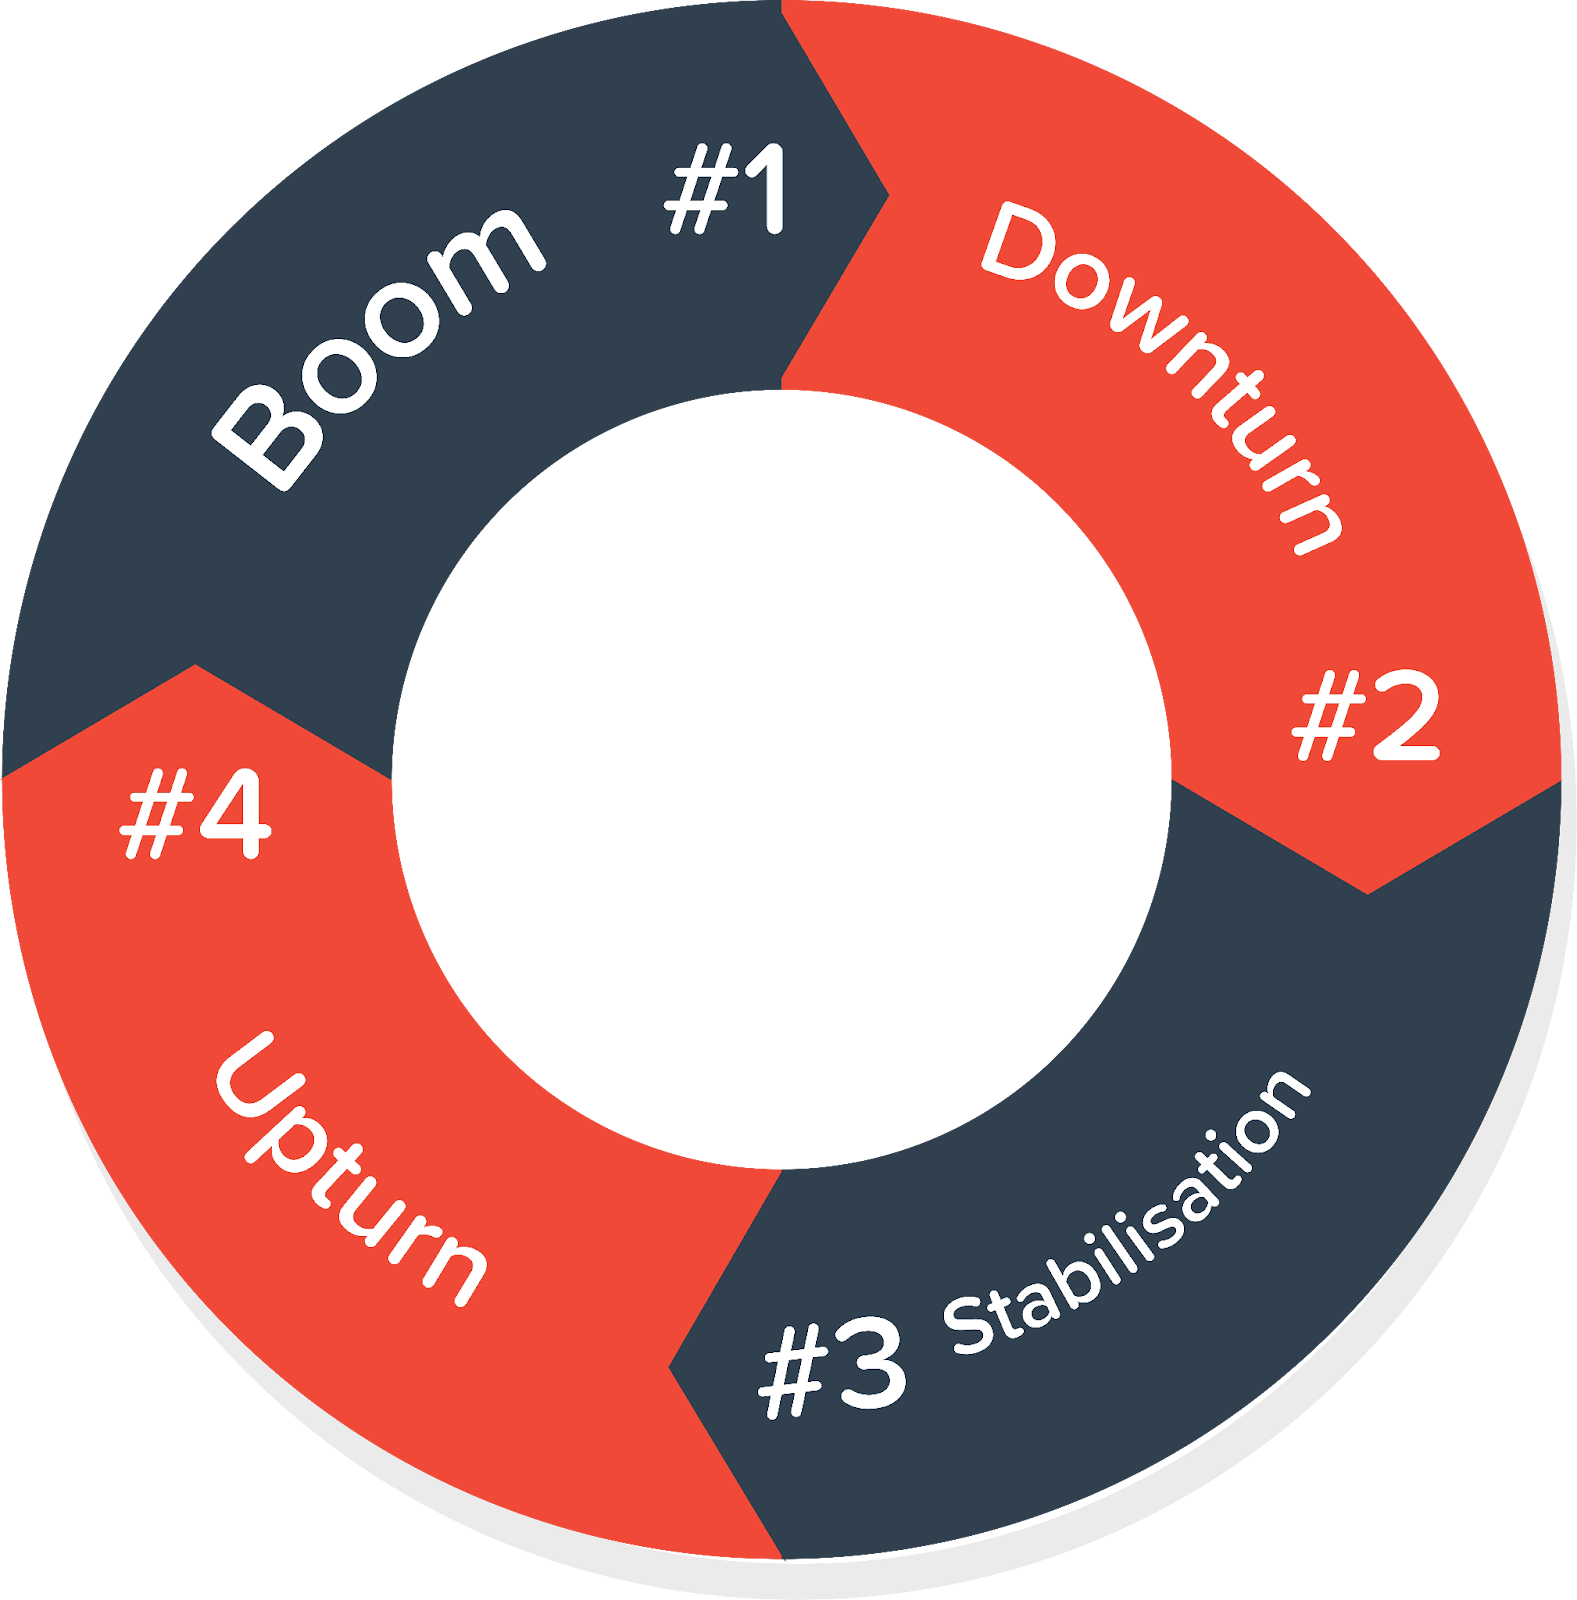
Property Cycle Flowchart
Let's walk through each phase and what it means for you as an investor.
Stage 1: The "Boom" in Property Prices
Supply: Mid-High Demand: High
Investors are looking forward to this stage. Home prices rise rapidly, demand peaks, and clearance rates skyrocket. This period is a good opportunity to sell if you want to. This phase usually lasts only one to two years and makes investors pay close attention to the final stages of the previous cycle so they can act quickly and take advantage of the boom before it ends.
Stage 2: The "Downturn."
Supply: High Demand: Low to Mid
After a property boom, demand falls, but supply remains high because developers keep building. Higher vacancy rates and lower rental costs characterise this downturn phase. It's not unusual for property values to go down, and developers may have to let people go and be financially weak. This stage usually lasts three to four years, but it might last longer if there's a long "boom."
Step 3: The "Stabilisation" Period.
Supply: Mid Demand: Mid
During the stabilisation stage, the market adjusts to a surplus of properties for sale and a shortage of buyers. Interest rates usually go down, and property prices start to slowly go back up. This time can be beneficial for investors because prices are lower and market competition is lower, making it a good time to buy.
Stage 4: The "Upturn".
Supply: Medium Demand: High
As buyers return to the market, competition rises, lowering vacancy rates and raising rental and property prices. Developers launch big projects with the goal of finishing them before the boom phase begins. The upturn usually lasts three to four years, during which time property prices rise, setting the groundwork for the next "boom."
How Long Does a Property Cycle Last in Australia?
| Cycle Characteristic | Typical Pattern | Current Situation (2026) |
| Full cycle length | 7-10 years | Compressed due to pandemic disruption |
| Boom phase | 2-3 years | Capitals have boomed; regional next |
| Slowdown phase | 1-2 years | Beginning in some capitals |
| Plateau phase | 1-3 years | Not yet reached nationally |
| Upturn phase | 2-4 years | Building in regional hubs |
Historically, we're looking at about 7 to 10 years for a full cycle to play out. However, the pandemic presented an unexpected twist. Rapid interest rate movements, sudden demographic shifts, and a construction crisis have compressed these cycles in ways we haven't seen before.
Where Is Australia in the Current Property Cycle?
We're currently transitioning. The major capital cities have experienced their share of success, with some lasting longer than others. But the dynamics are shifting, and the next phase is already taking shape. Here is a brief data table of the current market dynamics in Australia. Scan it carefully.
| Market Indicator | Current Status | Trend |
| National dwelling values | +8.6% annually | Steady growth |
| National median home price | $873,000 | Record high |
| Capital city median | $979,000 | Approaching $1M |
| National listings | 20% below long-term avg | Tight supply |
| Capital city vacancy rate | 1.2% | Extremely tight |
| First Home Guarantee impact | +6.6% price effect | Strong demand |
Australia’s Current Market Cycle
Interest Rates, Inflation, and the RBA
Interest rates remain higher than our accustomed levels. Surprisingly, low interest rates are no longer driving the rise in housing costs. A deeper issue, a complete breakdown in supply, fuels it. The Reserve Bank of Australia (RBA) is closely monitoring the situation, and while rate cuts are imminent, they are anticipated to occur later rather than sooner. Westpac and NAB anticipate that the cash rate will remain at 3.6% for a prolonged duration. The market has adapted to this new reality.
Population Growth Meets Supply Shortage
Brendan Rynne, the Chief Economist at KPMG, bluntly stated that we are "massively undersupplied." This isn't a recent problem; it's decades in the making. However, the situation is now approaching a critical stage. New dwelling completions are running roughly 30% below what we actually need as a nation. Every day, more people need homes. Every day, fewer homes are being built to accommodate them.
The Construction Constraint
Building costs have eased slightly from their pandemic peaks, but they've settled at a permanently higher base. Apartment supply is forecast to average only 60,000 dwellings per year through to 2030, insufficient relative to projected population growth. That means fewer projects stack up financially. That means less supply. That means existing properties, especially in tightly held areas, become even more valuable.
Capital City vs Regional Performance Matrix
| CITY | FORECASTGROWTH | VACANCY RATE | KEY DRIVERS | CYCLE PHASE |
| Perth | 7-10% | 0.7% | Mining and affordability | Late Boom |
| Brisbane | 7-10% | 0.9% | Olympics and Migration | Peak Boom |
| Adelaide | 6-9% | 0.8% | Affordability and supply crunch | Boom |
| Sydney | 5-7% | 1.3% | Prestige Market and Affordability | Slowdown beginning |
| Melbourne | 5-7% | 1.4% | Rebounding from lag and Investor Tax | Early slowdown |
| Canberra | Moderate | 1.5% | Public sector driven | Plateau |
| Hobart | 4-7% | 1. 1% | Lifestyle Recovery | Slow upturn |
| Darwin | Strong Rebound | 1.0% | Infrastructure spending and Defence | Rapid upturn |
The Capital City Real Estate Market Picture 2026
Perth is leading the charge, with forecasts suggesting growth of around 7-10%. Brisbane isn't far behind, still riding the Olympic wave and the Queensland lifestyle appeal. Both cities have benefited from tight supply conditions; active listings are down about 45% from pre-pandemic levels, and strong population inflows are driving growth. However, if we talk about Sydney and Melbourne, they're still growing, but more modestly at 5-7%. Affordability has hit a ceiling, particularly in Sydney. The numbers simply don't stack up the way they used to for everyday investors.
Why Cycles Differ by Location
Here's the crucial insight: markets don't move in lockstep. While Sydney cools, Perth booms. While Melbourne plateaus, regional hubs heat up. This isn't random. It's logical. It's the ripple effect. Think of the capital cities as stones thrown into a pond. The initial splash is dramatic; that's the boom. But the ripples keep moving outward, reaching shores that were calm just moments before. And right now, those ripples are heading straight towards Australia's major regional centres.
The Ripple Effect: How Growth Spreads
Stage 1: The Splash: Capital cities boom, such as Sydney and Brisbane, and the three main characteristics of this stage are:
- Price Surge
- FOMO arise among the Investors
- Limited Supply
Stage 2nd: The Barrier: Theaffordability ceiling hits at this stage and the three main characteristics of this stage are:
- Investors priced out
- Borrowing Capacity maxed
- Rental Yield Compress
Stage 3rd: The Search: Investors at this stage search for properties with this checklist:
- Entry prices under $700k
- Strong rental yields (4%+)
- Economic Fundamentals
- Infrastructure
Stage 4th: The Ripple Reaches Regions: Regional hubs with these strong foundations:
- Shepparton (agriculture and healthcare)
- Dubbo (Regional capital and services)
- Albury-Wodonga (Logistics and inland rail)
- Waiting for the next wave of growth
Key Insight: The ripple doesn’t stop at the city fringe. It flows all the way to the major regional centres, which have genuine economic weight.
The Propwealth Perspective: Why Shepparton, Dubbo, and Albury Are Next
We've been watching this pattern play out for years. When Sydney becomes unaffordable, buyers look to the Central Coast and Wollongong. When those markets heat up, the search expands further to major regional cities with real economic foundations.
| Location | Median House Price | Annual Growth | Rental Yield | Vacancy Rate | Key Economic Drivers |
| Dubbo | $630,000 | 8.62% | 4.66% | ~1.0% | Healthcare, education, government services, agriculture |
| Shepparton | ~$500,000 (est) | Moderate | 4.5%+ (est) | Tight | Agriculture (food bowl), healthcare, manufacturing |
| Albury-Wodonga | ~$600,000 (est) | Strong | 4.0%+ (est) | Tight | Logistics (Inland Rail), defence, healthcare, cross-border economy |
| Capital City Avg | $979,000 | 5-10% | 3.0-3.5% | 1.2% | Diverse |
Regional Hotspot Comparison Table
Shepparton isn't just a country town; it's an agricultural powerhouse, a healthcare hub, and a service centre for a massive surrounding region. When people leave Melbourne seeking space and affordability, Shepparton is on their radar. Population forecasts show steady household formation, with lone-person households expected to increase, driving demand for diverse housing stock.
Dubbo operates as the capital of the west for healthcare, education, and government services; it's got the economic diversity that supports sustainable growth. With a median house price of $630,000, 8.62% annual growth, and rental yields around 4.66%, these numbers makes dubbo an investor-ready suburb.
Albury-Wodonga sits on the border of two states, drawing from them. It's got infrastructure, employment, and lifestyle appeal that stretches far beyond its population numbers. Terry Ryder names it as one to watch, noting its position on the $31 billion Inland Rail link connecting Melbourne to Brisbane, the kind of infrastructure spend that transforms local economies.
Opportunities and Risks in the Next Cycle of 2026
The Opportunity: Getting In Before the Wave
The opportunity right now is simple identify the markets that will benefit from the next ripple before the mainstream catches on.
What to Look For in a Regional Investment Hotspot
- Population over 15,000 (critical mass)
- Major infrastructure spending committed or underway
- Vacancy rate below 1.5% (tight rental market)
- Increasing employment opportunities
- Strong sales activity (liquidity)
- Affordability relative to nearest capital city
- Tight housing supply, limited new development potential
- Strong economic foundations (not just one industry)
The Risk Matrix: What Could Go Wrong?
| Risk Factor | Description | Mitigation Strategy |
| Interest rate shock | Rates rise further, squeezing borrowing capacity | Fix rates, stress-test at higher rates |
| Overpaying in hype | Buying after the boom has already happened | Enter before mainstream media catches on |
| Single-industry dependence | Town reliant on one employer or sector | Choose diversified economies (health, govt, ag) |
| Illiquidity | Can't sell when you need to | Focus on population centres >15,000 people |
| Overbuilding | New supply floods market | Avoid areas with rampant development approvals |
| Infrastructure delay | Promised projects don't materialise | Invest where shovels are already in the ground. |
Evaluating the risk is not that hard and fast maths you need to do but you have to understand some of the basics of the market dynamics, such as buying into markets that lack genuine economic reasons to exist. A mining town dependent on one mine and one commodity is a gamble, not an investment. A coastal holiday spot with a population that halves outside summer won't sustain long-term growth . The investors who lose money in property cycles aren't unlucky. They're undisciplined. They chase yield without understanding what's underneath it.
Top 5 Investor Mistakes (And How to Avoid Them)
Mistake 1: Chasing the Peak
Investing in a market that has already experienced significant growth, with the expectation of a subsequent surge, is a common mistake. It's the equivalent of joining the party just as the host starts stacking chairs.
Mistake 2: Ignoring the Land-to-Asset Ratio
Choosing to purchase an older house on good land in a tightly held suburb instead of a shiny new apartment in a high-supply area is a mistake. Apartments can be replicated. Land can't.
Mistake 3: Assuming All Markets Move Together
Diversification isn't just about spreading risk; it's about positioning your investments in the markets that are about to move while others are standing still.
Mistake 4: Buying on Yield Alone
High yield can mask low growth. A 6% yield means nothing if the capital value is falling and the town has no future.
Mistake 5: Panicking During Plateaus
Selling during a flat market can result in missing the next upturn. The best gains come to those who hold through the quiet times.
The Bottom Line
The next property cycle isn't something to fear. It's something to understand. Right now, the ripples are spreading. The capital city boom is pushing demand outward, and the logical destinations are regional centres with genuine economic weight places like Shepparton, Dubbo, and Albury. At Propwealth, we're not guessing. We're watching the patterns, talking to the locals, and positioning our investors where the next wave is heading.
Your 2026 Action Plan
STEP 1: Review your portfolio against the cycle stage
STEP 2: Identify markets with strong fundamentals (use the Regional Hotspot Checklist)
STEP 3: Research regional hubs before mainstream media catches on
STEP 4: Stress-test your borrowing at current rates
STEP 5: Focus on land content and economic diversity
STEP 6: Have a 10-year horizon; ignore short-term noise
STEP 7: Speak to reliable experts.
REMEMBER: The best time to plant a tree was 20 years ago. The second-best time is today.
Ready to get ahead of the next cycle? The Propwealth team is on the ground in Australia's most promising regional markets. Book your free strategy call today or contact us directly at 409 016 39 to explore opportunities in Shepparton, Dubbo, and Albury before the next wave hits.